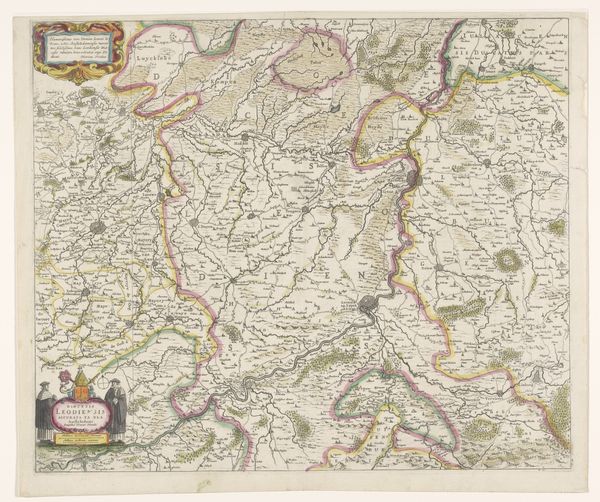
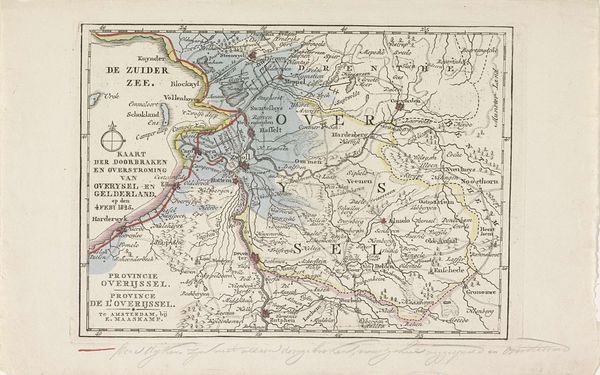
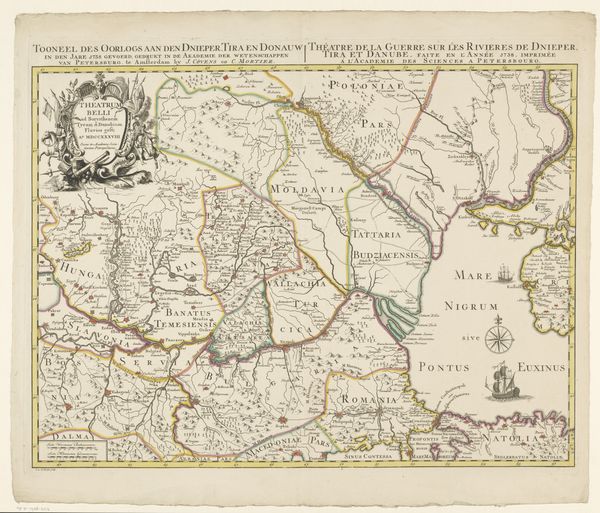
Kaart van het gebied in Groningen getroffen door de overstromingen in 1825 1825
0:00
0:00
anonymous
Rijksmuseum
drawing, print, ink, pen, engraving
#
pen and ink
#
drawing
# print
#
old engraving style
#
landscape
#
ink
#
pen
#
genre-painting
#
history-painting
#
engraving
Dimensions: height 180 mm, width 245 mm
Copyright: Rijks Museum: Open Domain
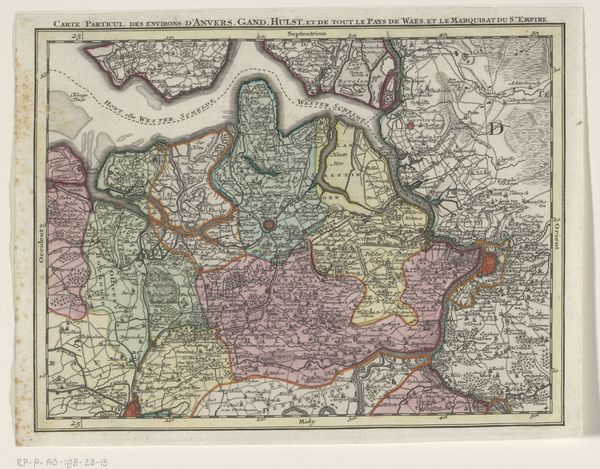
Editor: Here we have "Map of the Area in Groningen Affected by the Floods in 1825," an engraving by an anonymous artist. It's really interesting seeing this event visualized like this, and it's a reminder that cartography isn't just about geography, but also history and even tragedy. What does this map tell us about the socio-political landscape of the time? Curator: This map isn't simply a record of physical damage; it’s a representation of societal vulnerability and the government's role in managing disaster. Consider how the flooded areas are depicted: is there an attempt to minimize or perhaps even exaggerate the impact? And how might that representation have influenced public opinion or relief efforts? Editor: That’s a good point. I suppose depending on who commissioned the map, the message could be different. Who would have been the audience for this type of map? Curator: Precisely. This could be for government officials needing to assess the damage for resource allocation. It might have been intended to garner sympathy or encourage donations from wealthier citizens, or for scientific use related to understanding waterways and flood dynamics. What details stand out to you in terms of the landscape itself? Editor: Well, seeing how the waterways weave and cut through the province does make the area seem very vulnerable to this kind of event, almost like a risk that's naturally built into the environment. But thinking about the government response and potential biases changes my perception of it completely. Curator: Indeed. Examining maps like these allows us to understand how political forces influence the portrayal and perception of events. Understanding this influence reveals the complex relationships between environmental events, human actions, and the power of visual communication. Editor: I didn't think I could get so much from just looking at a map!
Comments
No comments
Be the first to comment and join the conversation on the ultimate creative platform.
More like this